The 1% rule: how much to risk per trade
Ask ten traders how much they risk per trade and you will hear everything from 1% to half the account. The professionals cluster tightly around one number — roughly 1% of the account on any single idea — not because they are timid, but because they have done the arithmetic on losing streaks. This post walks through that arithmetic so you can set your own cap with evidence instead of intuition.
What “1%” actually means
Risk is not the amount you deposit on a trade — it is the amount you lose if your stop is hit. Risking 1% of a $3,000 account means every stopped trade costs about $30, regardless of how large the position is. The position size simply scales so that the distance to your stop equals that $30. Two trades with identical dollar risk can hold very different lot sizes; the stop distance is what separates them. This is why risk comes first and size is derived — the position size calculator exists to do exactly that conversion.
Losing streaks are normal, not bad luck
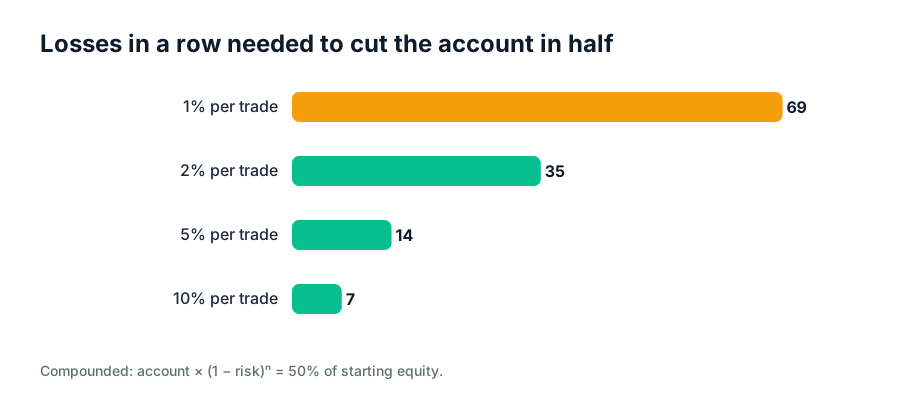
A strategy with a solid 45% win rate will still produce streaks of five, six or seven consecutive losers purely by chance — several times a year. Your risk-per-trade has to make those streaks boring. The bar chart below shows how many straight losses it takes to halve an account at different risk levels. At 1% it takes 69 — effectively a full year of bad trading to do serious damage. At 10% it takes just 7, which is one bad fortnight.
The recovery trap
The reason streaks matter so much is asymmetry: losses and required gains are not symmetric. Lose 10% and you need 11% back. Lose 50% and you need 100% back — a full doubling just to break even. Percent risk keeps you far away from the steep end of that curve, which is where accounts go to die. The deep math on this lives in drawdown territory; understanding volatility and how drawdowns compound is the difference between a bad week and a blown account.
Setting your own number
One percent is a starting point, not a law. Newer traders are usually better served below it — 0.5% turns the same streaks into rounding errors while you are still paying tuition in experience rather than cash. Traders with proven, backtested edges sometimes go to 1.5–2%. What almost never survives contact with reality is anything above 5%: the streak arrives eventually, and the recovery math above takes over. Whatever number you choose, apply it consistently — mixed sizing is how one “sure thing” erases a month of discipline.
What different risk levels cost you over a 7-loss streak
| Risk per trade | Cost of 7 straight losses | Gain needed to recover |
|---|---|---|
| 0.5% | ≈ 3.4% of account | ≈ 3.5% |
| 1% | ≈ 6.8% of account | ≈ 7.3% |
| 2% | ≈ 13.1% of account | ≈ 15.1% |
| 5% | ≈ 30.2% of account | ≈ 43.2% |
| 10% | ≈ 52.2% of account | ≈ 109.2% |
Quick answers — 1% rule
Is 1% per trade too small to make money?
At 1% risk with a 1:2 reward ratio, a 45% win rate earns roughly +0.35R per trade — about 0.35% of the account on average. On $3,000 that is modest but real, and it compounds. Profitable scaling comes after consistency, not before.
Should I risk more when I feel very confident?
Confidence is not a statistical input — even a great setup is one headline away from failing. Keep the risk identical and let the repeated edge do the work. Oversizing “sure things” is the most common way disciplined traders lose discipline.
Does 1% risk mean 1% margin?
No. Margin is the deposit the broker holds; risk is what you lose at your stop. A trade can use 3% of the account as margin while risking exactly 1% — the margin calculator and the risk math answer different questions.
Keep exploring on PipAtlas — 1% rule
_Sources: Investopedia — position sizing — reference material; PipAtlas is education only, never financial advice._
Related reading — 1% rule
- Why most beginners blow their account in 90 days — Three numbers prevent most beginner blowups — risk per trade, position size and the math of losing streaks. Plain…
- Backtest one risk rule in a single evening — You do not need software or a year of data to test your risk rules. A spreadsheet, 40 historical setups and one…
- Stop-loss placement made simple — distance first, lots second — A stop only works if the distance and the lot size agree. Learn to place stops around structure and volatility…