Drawdown and recovery: the math that changes how you behave
Every trader meets drawdown eventually — the distance from your account’s peak to its trough. What separates traders who survive it from traders who churn out is not pain tolerance; it is understanding one very lopsided curve. This post draws that curve and turns it into three habits.
The curve is not symmetric
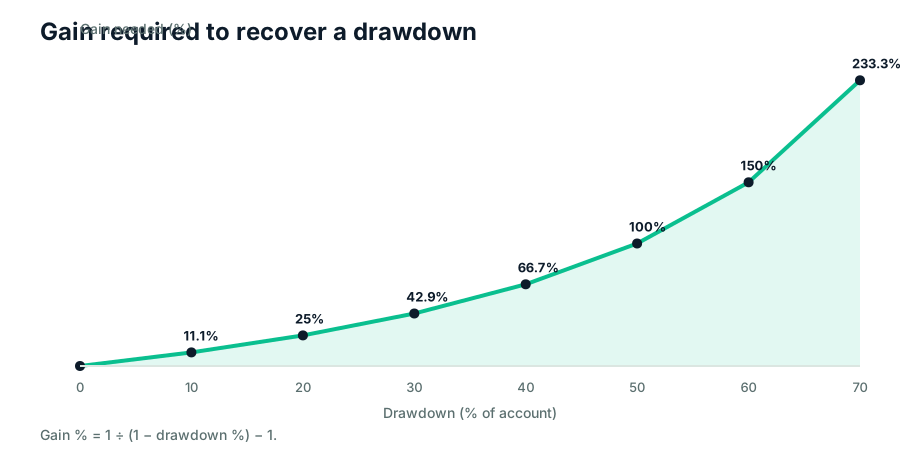
Recovering from a drawdown is harder than falling into it, and the difficulty grows much faster than the loss. Lose 10% and an 11% gain puts you back. Lose 30% and you need 43%. Lose half the account and nothing less than doubling it gets you level. The chart below plots loss against the exact gain required to break even — note how it bends violently past 40%. Everything about risk management is an argument for staying on the flat part of that curve.
Where drawdowns come from
Two very different sources, and they need different responses. Streak drawdowns are the normal randomness of trading — seven losers in a row at honest 1% risk is a ~7% dip and requires no action beyond keep going. Behavior drawdowns are self-inflicted: oversizing after a loss, skipping stops, revenge trades. A 7% dip from a normal streak is weather; a 30% hole is almost always behavior. The first response to any large drawdown is therefore an audit of your last twenty trades, not a bigger position to win it back.
How deep is too deep?
A practical line many experienced traders draw: if it would take more than a quarter of your usual monthly gains to recover, something is structurally wrong. For most retail traders that puts the red zone around 15–20%. Below that, drawdown is a cost of doing business. Above it, cut size in half — not out of fear, but because the recovery math says your edge needs a survivable account to express itself. Sizing rules and the 1%-style risk caps exist precisely to keep the trough shallow.
Three habits that cap the damage
One: fixed fractional risk — the same small percent every trade — so streaks subtract linearly, not catastrophically. Two: a weekly review that separates luck from process, so behavior drawdowns get caught at 5%, not 30%. Three: a hard de-risking rule written in advance: for example, every 5% below your equity peak, halve position sizes until you make a new high. Written rules survive the emotions of the moment; intentions do not.
Drawdown vs. gain required to break even
| Drawdown | Gain required | Difficulty |
|---|---|---|
| 5% | 5.3% | trivial |
| 10% | 11.1% | easy |
| 20% | 25% | manageable |
| 30% | 42.9% | painful |
| 50% | 100% | brutal |
| 70% | 233.3% | usually fatal |
Quick answers — Drawdown and recovery
What is a normal drawdown for a good strategy?
Systematic strategies typically run 10–20% historical max drawdowns while making their returns. If your live dip is inside what your backtest produced, it is noise. If it is far beyond it, the sample or the discipline has broken — review before sizing up.
Should I stop trading during a drawdown?
Stopping entirely during normal streaks prevents you from exercising the very edge you tested. The middle path: reduce size on a pre-written schedule, and trade through. Only a behavior-driven drawdown argues for a full pause and an audit.
How do I calculate drawdown in practice?
Track your account equity peak; drawdown at any moment is (peak − current) ÷ peak. A simple spreadsheet row per week is enough — the habit of looking at it matters more than the tool.
Keep exploring on PipAtlas — Drawdown and recovery
_Sources: Investopedia — drawdown — reference material; PipAtlas is education only, never financial advice._
Related reading — Drawdown and recovery
- Risk-reward ratio: why 1:2 wins even when you lose often — The breakeven math behind risk-reward ratios, why a 40% win rate can print money, and how to set targets that the…
- Trading gold (XAUUSD): five rules that keep beginners safe — Gold rewards respect: real pip values, wide daily ranges, fast spikes and honest position sizing. Five concrete rules…
- Stop-loss placement made simple — distance first, lots second — A stop only works if the distance and the lot size agree. Learn to place stops around structure and volatility…