Risk-reward ratio: why 1:2 wins even when you lose often
Beginners grade trades by how often they win; professionals grade them by what they win when right versus what they lose when wrong. That single swap in perspective explains why a trader who is wrong most of the time can compound steadily — and why a trader who wins 70% of the time can still bleed out. The whole thing is one line of arithmetic.
The breakeven table
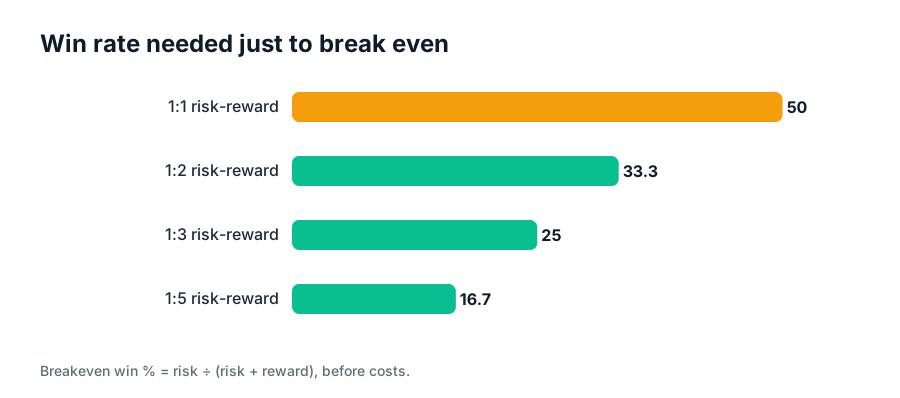
For every reward-to-risk ratio there is an exact win rate at which you break even. Below it you lose; above it, every trade carries positive expectancy. The numbers surprise people: at 1:2 you only need to be right a third of the time. This is why fixed, disciplined ratios forgive imperfection — the market hands out losing trades generously, and 1:2 pricing makes losers affordable.
A 40% win rate, worked end to end
Take a realistic strategy: 40% winners, targets at 2R, stops at 1R. Expectancy per trade = (0.40 × 2) − (0.60 × 1) = +0.2R. Ten trades a week at 1% risk compounds roughly +2% weekly before costs — from being wrong 60% of the time. Now flip it: the same accuracy at 1:1 ratios earns (0.40 × 1) − (0.60 × 1) = −0.2R and dies slowly. Identical entries, identical read of the market — the ratio is the strategy.
Why 1:5 fantasies break
The table also explains the opposite failure. Chasing 1:5 means being right fewer than one time in five just to cover costs — and the market rarely hands five-R moves to fixed targets; it hands them to runners you let breathe. Demanding huge ratios forces you to enter only at perfection, skip most opportunities, and psychologically abandon targets that never arrive. For most retail strategies, 1:2 to 1:3 is the productive zone: far enough to matter, close enough to actually get paid.
Setting targets the market will actually pay
A 1:2 target is not “pick twice your stop distance” — it is find a level the market must travel to from your entry, then check the distance is at least twice your stop. If the next real resistance sits 1.5R away, the honest choices are a wider-stop entry with smaller size, or no trade. Let the structure set the target and the stop set the size — the position size calculator handles the conversion, and stop placement principles keep the stop side honest. Costs count too: the wider your ratio, the less spreads eat — see the true cost breakdown in any pip-cost check before finalizing targets.
Expectancy at a 40% win rate, by target ratio
| Ratio | Breakeven win rate | Expectancy at 40% wins |
|---|---|---|
| 1:1 | 50.0% | −0.20R (loses) |
| 1:2 | 33.3% | +0.20R |
| 1:3 | 25.0% | +0.40R |
| 1:5 | 16.7% | +0.80R (rarely reachable targets) |
Quick answers — Risk-reward ratio
Is a high win rate worthless?
Not worthless — but meaningless without the ratio. 90% winners at 1:10 risk can still lose money overall. Grade every strategy by expectancy in R, never by hit rate alone.
Should I move my stop to improve the ratio?
Never the stop — it belongs where the idea is wrong. If the ratio is poor, fix it with entry timing or a smaller target at real structure. Widening stops to manufacture ratios converts bad prices into bad losses.
What about partial exits?
They are fine as psychology, but know the math: banking half at 1R caps your winners and quietly shifts your effective ratio toward 1:1. If you take partials, track the blended R in your journal so the strategy you measure is the one you trade.
Keep exploring on PipAtlas — Risk-reward ratio
_Sources: Investopedia — risk/reward ratio — reference material; PipAtlas is education only, never financial advice._
Related reading — Risk-reward ratio
- Expectancy — the one number your strategy owes you — Win rate is vanity, expectancy is the truth. How to compute what your strategy actually pays per trade, and why most…
- Drawdown and recovery: the math that changes how you behave — Why a 30% loss needs a 43% gain to break even, how the recovery curve steepens, and the habits that keep drawdowns…
- Stop-loss placement made simple — distance first, lots second — A stop only works if the distance and the lot size agree. Learn to place stops around structure and volatility…