Pick your platform, then follow the install steps below. Test on a demo chart first. All indicators →
What it draws
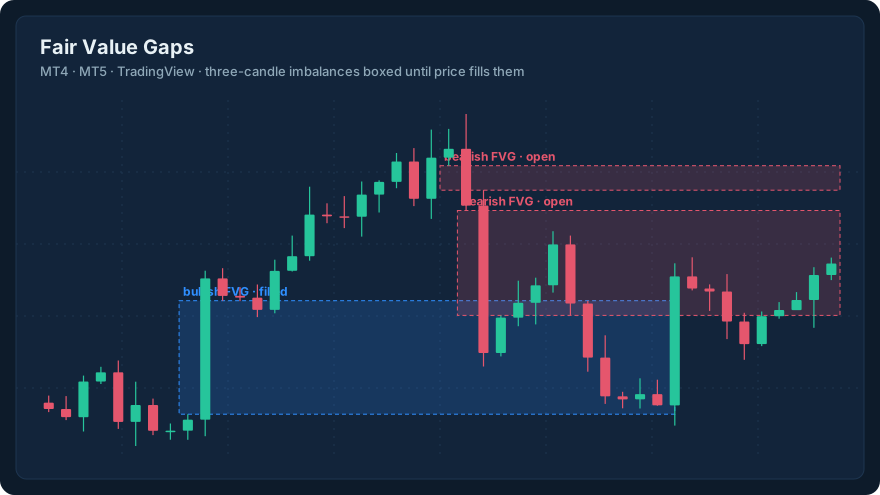
A fair value gap (FVG) is a three-candle pattern where the middle candle moves so fast that the wicks of the first and third candles don't overlap. That leaves a price range the market skipped. This indicator finds those ranges and draws them as boxes on your chart, so you can see where price moved without trading much on the way.
A bullish gap appears when the third candle's low sits above the first candle's high. The box runs from the first candle's high up to the third candle's low. A bearish gap is the mirror image: the third candle's high sits below the first candle's low.
Once a later bar trades fully through a box, the gap counts as filled, and the box is removed. If you'd rather keep a record of filled gaps, switch on "Keep boxes after they fill".
If the idea itself is new to you, the fair value gap glossary entry explains it with an example first.
Inputs and defaults
| Input | Default | What it does |
| --- | --- | --- |
| Bars to scan | 300 | How far back the indicator looks for gaps. |
| Max boxes drawn | 15 | Caps the number of boxes so the chart stays readable. |
| Keep boxes after they fill | Off | Leave filled gaps on the chart instead of removing them. |
| Bullish gap colour | Blue | Colour of gaps below price that formed on up-moves. |
| Bearish gap colour | Red | Colour of gaps above price that formed on down-moves. |
| Box border style (MT4/MT5) | Dotted | Line style of the box outline. |
The TradingView version has the same settings, with semi-transparent colours so boxes don't hide the candles.
How traders use it (and what it can't do)
Some traders watch unfilled gaps as areas where price may react when it comes back, because the move through them was one-sided. Others use them only as context, alongside order blocks or a liquidity void on a higher timeframe.
Be honest about the limits. A gap is a description of what price already did, not a forecast. Many gaps fill without any reaction at all, and on lower timeframes there are so many that most of them mean nothing. The indicator doesn't send alerts, doesn't place trades, and doesn't tell you which gaps matter. Treat it as a way to see the chart more clearly, then test any idea on a demo account before using it with real money.
Download & install — Fair Value Gaps Indicator
⬇️ Download pipatlas-fair-value-gaps.mq5 (MT5 · MIT)
⬇️ Download pipatlas-fair-value-gaps.mq4 (MT4 · MIT)
⬇️ Download pipatlas-fair-value-gaps.pine (TradingView · MIT)
- MT5: File → Open Data Folder → MQL5 → Indicators → copy the .mq5 file in → open MetaEditor and press F7 to compile → refresh the Navigator and drag it onto a chart.
- MT4: File → Open Data Folder → MQL4 → Indicators → copy the .mq4 file in → compile in MetaEditor (F7) → refresh and attach.
- TradingView: open the Pine Editor, paste the .pine file, press "Add to chart", then save it to your scripts.
Frequently asked questions — Fair Value Gaps Indicator
Does the indicator repaint?
A box is only drawn once the third candle has closed, so a finished gap won't move later. It disappears when price fills it, unless you switch on "Keep boxes after they fill".
Which timeframe works best?
There isn't a best one. Higher timeframes produce fewer, larger gaps; lower timeframes produce many small ones. Start on the timeframe you already trade and reduce "Max boxes drawn" if the chart gets crowded.
Is it free to use and change?
Yes. It's original PipAtlas code under the MIT licence, supplied as readable source, so you can read every line before you run it.
Related — Fair Value Gaps Indicator
More free tools: the full Indicators & EAs Library.