Pick your platform, then follow the install steps below. Test on a demo chart first. All indicators →
What it draws
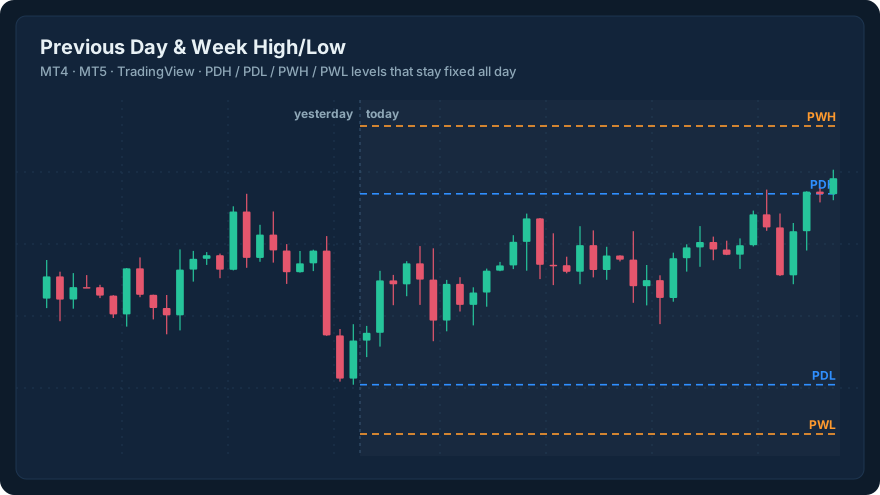
Yesterday's high and low are some of the most watched prices on any chart. Traders call them PDH (previous day high) and PDL (previous day low), and last week's extremes PWH and PWL. This indicator draws those levels as dashed lines, starting at the beginning of the current day or week, with a small price label at the right edge.
Each level comes from the finished previous period. Today's PDH is yesterday's completed high, so it can't move while today's session is running. Day levels only show on intraday charts. Week levels show on intraday and daily charts. You can also switch on last month's high and low.
If the idea of levels where orders tend to cluster is new to you, read liquidity and support and resistance first.
Inputs and defaults
| Input | Default | What it does |
| --- | --- | --- |
| Previous day high/low | On | Draws PDH and PDL on intraday charts. |
| Previous week high/low | On | Draws PWH and PWL on intraday and daily charts. |
| Previous month high/low | Off | Draws PMH and PML. |
| Price labels | On | Shows the level name and price at the right edge. |
| Day / week / month colour | Blue / orange / purple | Line and label colours. |
| Line style (MT4/MT5) | Dashed | Style of the level lines. |
| Alert when price crosses a level (MT4/MT5) | Off | Pops an alert when the bid crosses any drawn level. |
On TradingView the alerts work differently. Add the indicator, then create an alert and pick one of its four conditions, such as "Crossed previous day high".
One thing to check first: your broker's day
On MT4 and MT5 a "day" follows your broker's server clock, not your local time. Most forex brokers run on New York close (GMT+2 or GMT+3), which gives five clean daily candles a week. Some brokers add a short Sunday candle, and then Monday's "previous day" is just that thin Sunday session. If your PDH and PDL look oddly close together on a Monday, that's why. TradingView uses the exchange session of the symbol you're viewing, so its levels can differ slightly from MT4's on the same pair.
How traders use it (and what it can't do)
Some traders treat PDH and PDL as places where stop orders collect, and watch for a quick push beyond them that reverses. That's the idea behind a liquidity sweep. Others use them like classic pivot points, as reference prices for where the day's range might stretch to. A break and close beyond the previous week's high is also a common way to describe a range turning into a trend.
Be honest about the limits. These levels describe where price has been. They don't say it will react there, and plenty of days slice straight through PDH without a pause. The indicator doesn't place trades or rank levels by importance. Use it to read the chart more clearly, and test any idea on a demo account before you risk real money.
Download & install — Previous Day High/Low Indicator
⬇️ Download pipatlas-previous-day-high-low.mq5 (MT5 · MIT)
⬇️ Download pipatlas-previous-day-high-low.mq4 (MT4 · MIT)
⬇️ Download pipatlas-previous-day-high-low.pine (TradingView · MIT)
- MT5: File → Open Data Folder → MQL5 → Indicators → copy the .mq5 file in → open MetaEditor and press F7 to compile → refresh the Navigator and drag it onto a chart.
- MT4: File → Open Data Folder → MQL4 → Indicators → copy the .mq4 file in → compile in MetaEditor (F7) → refresh and attach.
- TradingView: open the Pine Editor, paste the .pine file, press "Add to chart", then save it to your scripts.
Frequently asked questions — Previous Day High/Low Indicator
Does the indicator repaint?
No. Every level comes from the previous completed day, week or month, so it's fixed for the whole current period. It only moves when a new day, week or month begins.
Why don't I see the daily levels on my daily chart?
On a daily chart, yesterday's high and low are just the previous candle, so day levels are hidden there. Week levels stay visible, and month levels show up to the weekly chart.
Is it free to use and change?
Yes. It's original PipAtlas code under the MIT licence, supplied as readable source, so you can read every line before you run it.
Related — Previous Day High/Low Indicator
More free tools: the full Indicators & EAs Library.